Latest Update 19/4/21
Exciting news! Our team has just released a major update to Bitcatcha’s much-loved speed test tool. In addition to measuring server speed, our tool now also measures website speed! Read the article to learn how it works.
Our website speed test can help you increase sales and conversions for your online business.
If you’re interested in knowing how, then stick around. We’ll be going through everything you need to know about our website speed checker in detail, and why it’s crucial for your business.
How We Define Website Speed
What Exactly Our Tool Measures, and Why
What Your Website’s Rating Means
What You Can Do to Improve Each Metric
Wrapping Up
Frequently Asked Questions
A wise man once said that patience is a virtue, but in real life, nobody likes having to wait. Be it at the checkout counter, for the lights to go red, or even for the elevator, people just don’t like waiting.
This is even more pronounced on the internet where people are so accustomed to lightning-fast speeds, they feel that 3 measly seconds is way too long to wait for a site to load.
This sounds absolutely ridiculous, but that doesn’t make it any less true.
According to Think with Google, the probability of users bouncing increases to 32% if the site takes between 1 to 3 seconds to load on mobile, and the number gets even more absurd with every passing second.
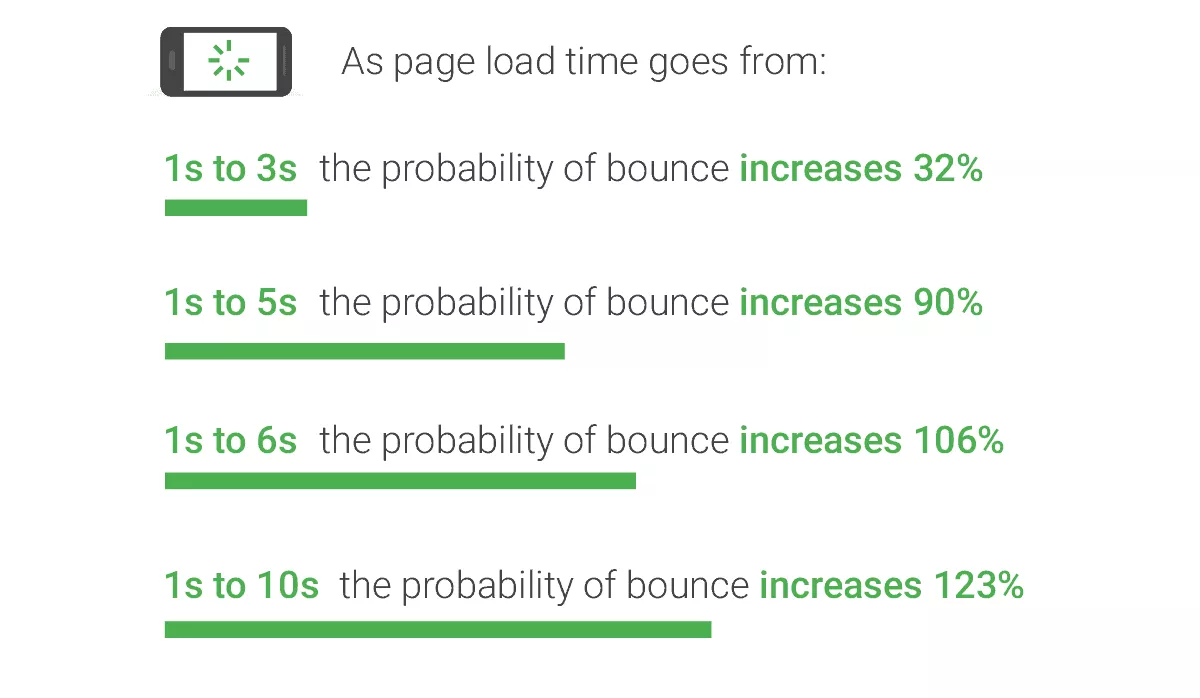
This is critical because if you’re running a business online, you’re basically losing out on 32% of your visitors before you even get a chance to convert them into paying customers!
That’s not all, folks.
Google has actually announced that Core Web Vitals will soon be a part of their ranking criteria, and out of the 3 Web Vitals (Largest Contentful Paint, First Input Delay, Cumulative Layout Shift), the first 2 are highly dependent on speed.
This means that if your website is too slow to load, It’s gonna provide a poor user experience. With poor user experience, Google isn’t gonna prioritise your site when it comes to rankings, which means the chances of people seeing your site is gonna drop. You see where we’re going with this right?
Slow loading website
↓
Less ranking priority
↓
Website has no visibility
↓
Website has zero sales
If you want to increase sales and conversions, your website needs to load up as fast as possible. We’ll show you exactly how you can do that.

A lot of people aren’t aware of this, but website speed is actually divided into 2 categories: server speed, and website loading speed. They might sound alike, but they definitely aren’t the same.
Server speed, which is your web hosting service, is pretty much the heart of your website. How fast your website actually does anything is dependent on how fast your web hosting service is.
Think of it like a car. The better the engine, the faster the car can go. We measure server speed by how long it takes (in milliseconds) for the server to respond to requests.
Website loading speed is based on web design, cleanliness of code, cache, plugins and visual media. All these definitely help with site load speed, but if your server is slow, everything else will also be slow.
Again, think of it like a car. You can upgrade your transmission, add a turbocharger, swap out rims for lighter ones to increase performance. But if the engine’s a weak little slowpoke, none of these is gonna help.
So, your web hosting and coding wizardry work hand-in-hand to make your site fast and snappy, but if the web hosting is slow, no amount of code optimisation is gonna save your site.
Core Web Vitals are basically 3 different metrics that Google uses to determine your website performance: Largest Contentful Paint, First Input Delay, and Cumulative Layout Shift.
If your website satisfies all 3 Web Vital requirements, the chances of your site ranking on Google searches will most likely increase!

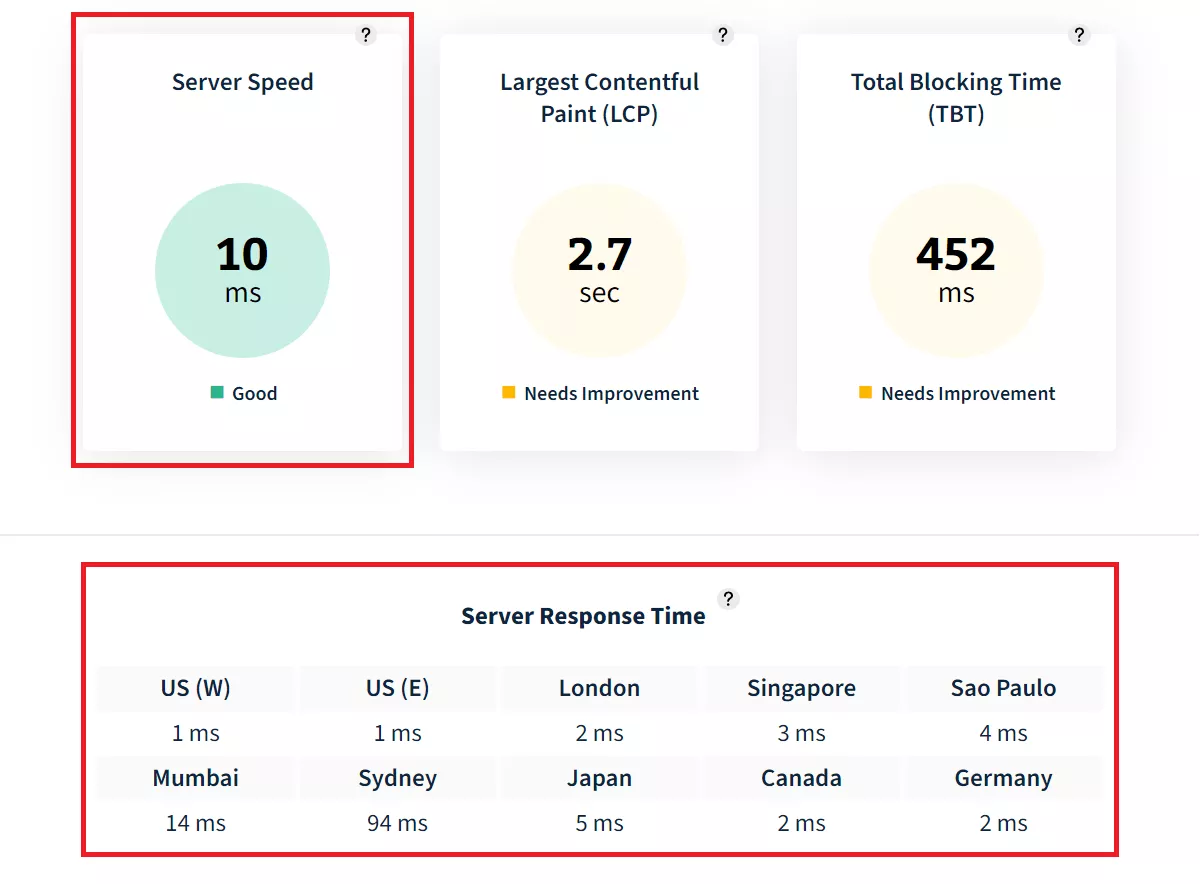
The website speed checker by Bitcatcha measures exactly 3 things:
When you key in the URL in our website speed checker, it will ping your site from our 10 global nodes, measuring how long it takes for your server to respond to these requests from around the world. This emulates 10 different people from all around the world accessing your website at the same time.
The end result is the worldwide average of your server speed, in milliseconds.
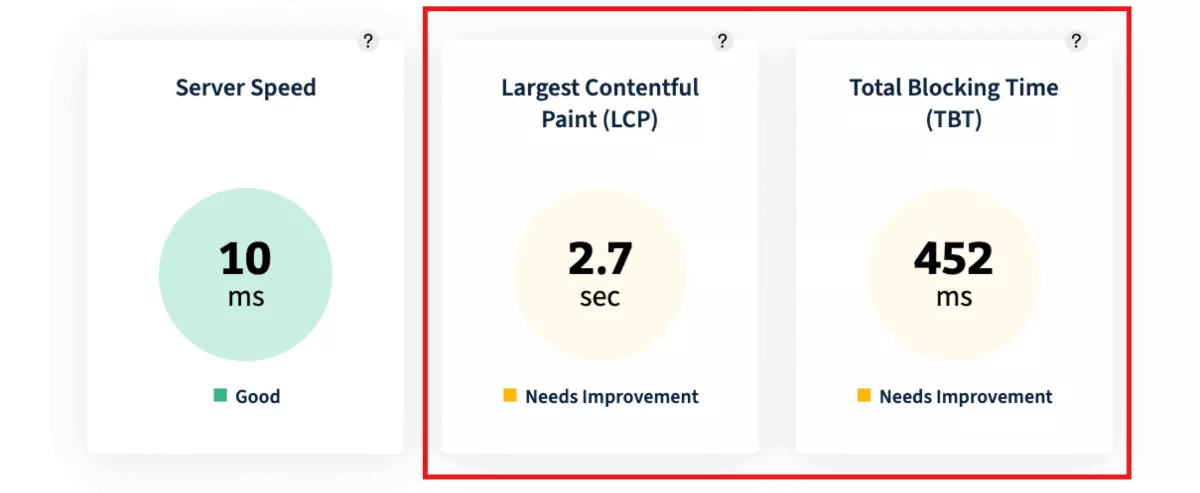
We measure LCP because we know that Google prioritises good user experience for their ranking, and slow load speeds don’t exactly count as good user experience.
To measure LCP, Lighthouse checks to see how long the largest visible element on your site takes to load (in seconds) and ranks that time. This is done automatically via the Lighthouse API which we have incorporated into our website speed checker.
TBT works by measuring the estimated total amount of time your browser is blocked when a site is being loaded. Picture this – loading images, text, JavaScripts, and everything else, draws power from the CPU, which blocks your browser from doing more.
By estimating the amount of time your browser is blocked because it’s loading something, Lighthouse can measure how good the user experience is. In short, the less time your browser spends being blocked, the better the user experience is.
By improving your TBT scores, your browser ends up being more responsive, which would naturally lead to an improved FID score!
TBT is measured instead of FID, because FID requires actual user data which can’t be simulated. Since TBT is a lab data that can actually be simulated, and good TBT scores naturally improves FID, it is used as a measurement device instead.
We want our website speed checker to be specially dedicated to measuring website speed, which would involve server response times, LCP and TBT. This way, our users can more accurately diagnose which part of their website is causing the bottleneck in site load speed – the web hosting, or the coding.
Since CLS measures visual stability, it has nothing to do with speed. Hence we’ve opted to leave it out of our website speed checker.

Now that we’ve explained how our tool works and what it does, you’re gonna want to know what your website’s rating means. Once you key in your URL and hit enter, you’ll be presented with your website’s Final Grading Score, which can range from A+ all the way to E.
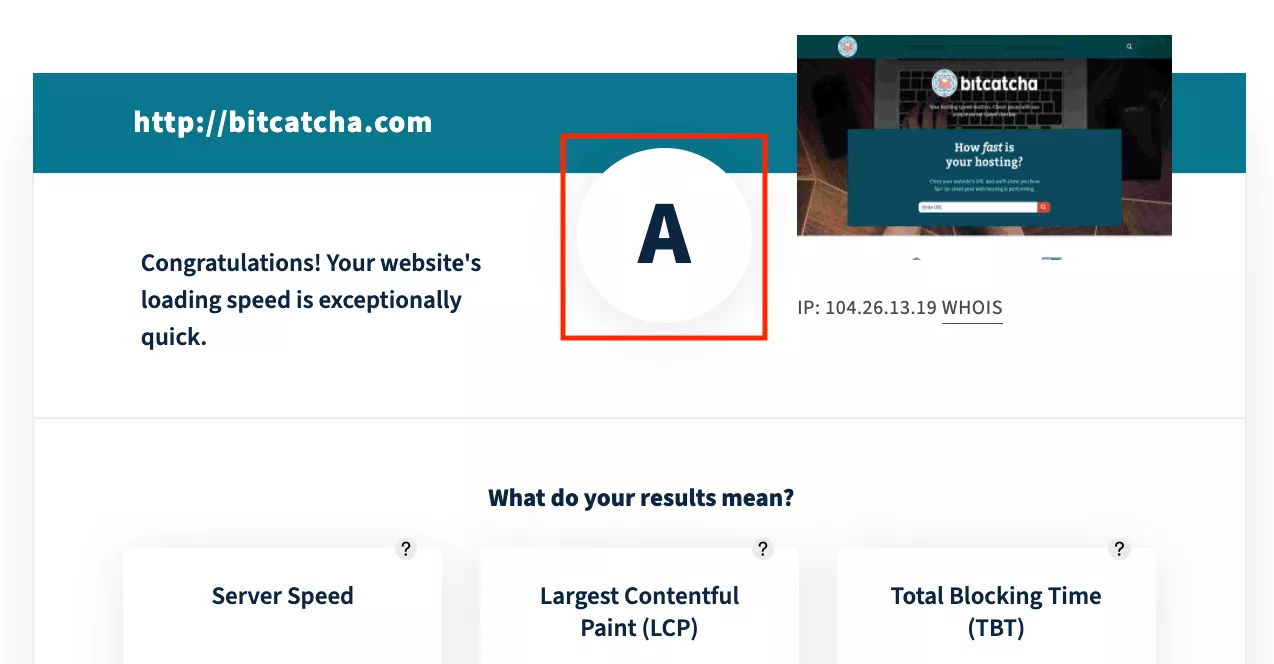
If your website consistently yields a B+ or better as the Final Grading Score, then some congratulations are in order – you’ve got a pretty fast running site! If you’re getting poorer results than that though, then you’re gonna have to start optimizing.
We use the results from our server speed test combined with the numbers from the Web Vital metrics, and convert them into a percentage. The percentage results from these 3 metrics are then averaged out to provide us with the server’s Final Score Grading, which is ranked below:
Obviously, you’ll want your Final Score Grading to be at A+ to ensure your site performs exceptionally well for users and to increase your chances of getting ranked on Google searches. At worst, you’ll want it at no less than a B.
But what can you do to improve your ratings?
Well, if you look closely, you can see that the individual metrics are actually colour coded.
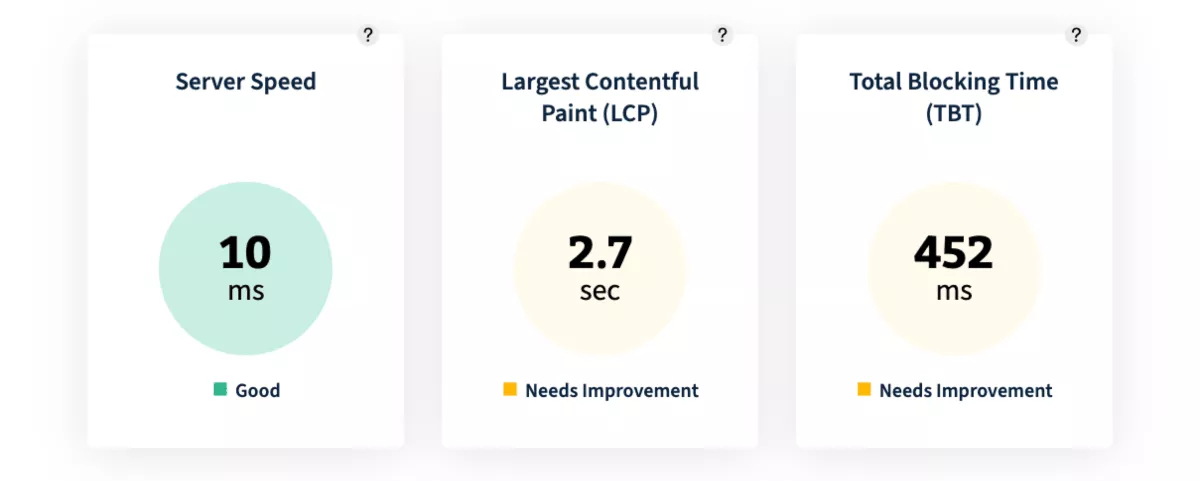
A good score will show up as green, a moderate one as yellow and if it’s bad, it’ll be red. To get an A+ rating, you’ll need all three metrics to show up as green.
As we mentioned earlier, once a URL is keyed into the speed checker, our 10 global nodes will ping the website and tell us how long it took to respond to each one of their requests, in milliseconds.
We use the numbers from these 10 locations to provide us with a Global Average. That Global Average is then rated according to the chart below.
The ideal Bitcatcha speed rating for your server speed result should be Good (180 ms and below). The ratings from our server speed metric provide you with a very good reference on how fast your web hosting service is.
Lighthouse (which is Google’s tool to test Web Vitals, incorporated into our website speed test) measures the LCP in seconds.
If the largest piece of content is loaded within:
TBT measures the amount of time your browser is blocked in milliseconds:
So, what score do the world’s top websites get?
We couldn’t resist putting the world’s most popular websites through our Bitcatcha website speed test tool. Visit our results page of the top 100 websites to see how well they perform, and how your site compares!

Now there’s a whopping 27 combinations of how the end results might end up and we can’t cover all of them, so we’re gonna focus on the basics: how to get a green rating on each individual metric.
This is as simple as it gets. If you’re consistently getting scores above 500 ms, you’ll want to take a closer look at your web hosting provider. Switching to one that’ll provide you with faster server speed would be highly beneficial! Check out our list of the fastest web hosting providers.
There are multiple things you can do to improve your LCP score. Fair warning though, things can get a little technical from here on so buckle up.
Here are a few things you can do to improve TBT scores.
The simplest way to improve your TBT is to have a simpler site. The most common problem that pulls down TBT ranking is a bloated JavaScript library that isn’t in use but still loaded in the website.
Getting rid of these and anything that blocks your browser render speed should result in an improved TBT score!
Web Vitals is a vast topic, and it won’t make sense for us to cover everything in this article. If you’re interested in more detailed solutions to your LCP and TBT woes, check out this page. It should provide you with an idea of what you’ll need to do to improve your scores!
If you don’t know how to do this yourself, you might want to consider hiring an expert to save you from the headache.
There you have it.
We’ve covered everything you need to know about our website speed checker and how it works. In case we lost you somewhere along the way, here’s a quick summary.
Our website speed checker tests 3 specific things:
These metrics will then provide you with a Final Grading Score which ranks your website on a scale of A+ all the way to E. You’ll want to ensure that your website gets at least a B+ ranking, or you’ll suffer from a drop in conversions/sales and Google rankings due to slow site load speeds.
You can improve your Final Score Grading by paying attention to the 3 metrics. Make adjustments and tweaks until all 3 metrics are Green, and you’ll get that coveted A+ ranking!
Our website speed checker tool will help you diagnose which portion of your website is causing slowdowns, making it easier for you to detect the bottleneck rather than waste precious time testing everything individually.
It’ll also help you meet Core Web Vital requirements, which increases your chances of getting ranked on Google, leading to increased sales!
If you’re at a loss to which web hosting to go for, we’ve researched who’s the best web hosting provider for you, which will come in handy regardless of whether you’re a blogger, online seller or a consultant.
Website speed can have a direct impact on your website conversions, since a faster website gives visitors a better user experience. A slow website can also negatively affect your ranking potential on search engines.
There are multiple reasons why a website can be slow – a bad web host, website code that isn’t optimized, or perhaps your website is just media-heavy. You can use our free website speed test to pinpoint where the problem is.
Simply test your website with our free website speed test. It generates a detailed report that will show you which metric is underperforming. From there, you’ll know which areas of your website you should take steps to improve.
Ideally – you’ll want to get green ratings on all 3 metrics in our test. As a minimum – you need to ensure your website’s average response time is faster than 180 ms, which can be achieved by using a fast web host.
The 10 locations featured in our server speed test include: US (W), US (E), London, Singapore, Sao Paulo, Mumbai, Sydney, Japan, Canada, and Germany.
Nope! You only need to paste your website’s URL into our tool to run the test. You’ll immediately be presented with a report of your website’s performance.
No – our tool only audits and tells you how your website is performing. However, we do provide suggestions on how you can improve your website’s performance across all metrics.